| Solution |
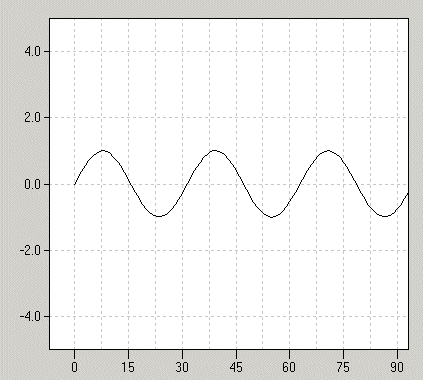
Suppose you want to draw a chart showing grid lines at a spacing of 7.5 units and tick marks at a regular spacing of 15 units (i.e. to display degrees).

Since RChart offers built-in tick marks which are based on a 1-2-5 scheme, but does not provide for user-defined spacings, you have to use the OnScalesRendered event to draw the tick marks yourself.
Thus, we first have to make the default axis invisible by setting the property Scale1X.Visible to FALSE. Next we insert the following code into the OnScalesRendered event handler:
procedure TForm1.RChart1ScalesRendered(Sender: TObject;
               var Canvas: TCanvas; Top, Left: Integer);

const
  xdist = 15;
  LTick = 10;

var
  x          : double;
  pixx, pixy : integer;
  tw         : integer;
  astr       : string;

begin
x := xDist*round(RChart1.Scale1X.RangeLow/xdist);
while (x < RChart1.Scale1X.RangeLow) do
  x := x + xDist;
while (x <= RChart1.Scale1X.RangeHigh) do
  begin
  RChart1.R2M (1, x, RChart1.Scale1Y.RangeLow, pixx, pixy);
  Canvas.MoveTo(pixx,pixy);
  Canvas.LineTo(pixx,pixy+LTick);
  astr := strff(x, 1, 0);
  tw := Canvas.TextWidth(astr);
  Canvas.TextOut(pixx-tw div 2, pixy+LTick, astr);
  x := x + xDist;
  end;
end;
The constant xdist specifies the spacing of the tick marks, the constant LTick defines the length of the tick mark.
|

 SDL Components
  RChart
  Tick Marks with a User-Defined Spacing
 SDL Components
  RChart
  Tick Marks with a User-Defined Spacing